
Breaking the ‘Iron Triangle’: Why Safety Is Integral to Your Company’s Success
The process of gathering, analyzing and synthesizing data about safety lags considerably behind other areas in sophistication.
Organizations seeking to implement safety programs for their workforce need to develop an approach that best serves their needs. While a safety culture varies from organization to organization, there are some consistent principles that help inform decision-making and show the value of introducing – and reinforcing – safety science to your organization.
Many engineering disciplines espouse the value of frameworks to help interpret and analyze data. One such framework is the triple constraint, also referred to as an iron triangle. Extracted from the principles of project management, the triple constraint posits that there are three critical elements of any project. It is only when all three elements, or constraints, are satisfied that the project will reach completion. Further, the quality of the project is contingent on these three constraints.
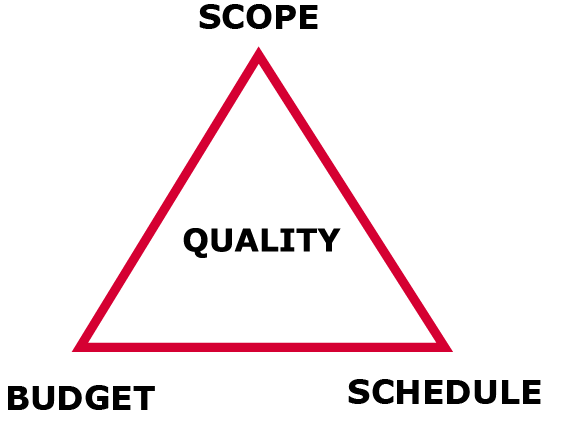
“Scope” defines what needs to be done; “Budget” is the capital required; “Schedule” is the amount of time remaining for delivery. This framework allows one to measure any task from something as simple as having a meeting to as complex as delivering a space shuttle.
Here’s how you might think of a meeting through this lens: The scope is an agenda — or what you set out to accomplish for the session. The budget would include considerations like physical space, or real estate, and the costs of maintaining it, as well as the wages for the workforce in attendance, for the duration of the meeting. The schedule is the length of the meeting. Now, if any of these constraints change, then inevitably the solution is impacted.
The tool becomes more valuable because applying the triple constraint to any project helps focus the team to a solution in a transparent way with the sharing of information at each point. Since these three points are connected, if there are any two defined points of the triangle we can then define the third with relative ease. If we understand the budget and scope of solving a problem, then we can make a reasonable guess at the schedule we will need to resolve it. Similarly, if we know the timeline we want to meet, and the budget for a project we can constrain the scope.
Next, let’s take another step with this framework and add a second triangle to refine the decisions we must make. Classically called PMBOK, this permits the planner the ability to see the tradeoffs in each corner of the overlaid triangles. As one example, the overlaid triangle shows that to define Schedule, we must have a clear definition of Resources and Risk.

Let’s take the next step. Risk and Safety are two intertwined concepts. As a safety science company, we understand risk as the opposite of safety. Replacing “Risk” with “Safety” in the diagram is quantitatively the inverse of risk.

Now, we see how even small investments in safety become amplified across the organization. This diagram shows the interconnected nature of all of these factors. And, using the overlaid triple-constraints we see there is a balance that is unique to not only the operations of a singular project, but the business as a whole.
When speaking to many of our clients for the first time, we learn that the process of gathering, analyzing and synthesizing data about safety lags considerably behind other areas in sophistication. Based on traditional data collection mechanisms — like clipboards and spreadsheets — the information about injuries is historical instead of predictive. When the safety data becomes predictive, actions can be taken immediately before injuries occur, before problems happen, and before other areas report impact.
Therefore, if we are to measure safety, we need the metrics and the data to do so. Like most data, safety data needs to be both accurate and current. If safety information is historical, inaccurate, misunderstood or under-represented, then the schedule and scope of all projects suffer. Following the models above, resourcing and the quality of output are also directly impacted by the lack of current, actionable safety information.
At this juncture, we have tracked the triple constraints at play in every organization; but, there’s a limitation with this analysis.
So far we have only been talking about static information. However, the reality is that the workforce which generates the derived safety data is constantly changing. The concept of constantly changing data is known as streaming data. To get to static information we have essentially only taken snapshots of the information at specific moments in time. Given that the data is streaming in real-time, we must plot the changes to the triple constraints on the time axis to stay current with reality. In order to do this, gathered data for each point is collected as a snapshot at a regular interval.
The result becomes an n-stacked set of paired triple constraints describing the organization metrics. Visually, the changes in each time step become highly visible.
The changes to the system become apparent when samples are taken at regular intervals. Often the impact is profound.
Closely monitoring the safety of individuals is not only a way to solve existing safety problems directly, but also creates opportunities for improvement that have traditionally been completely outside the scope of safety as a practice.
Read More

 Worker Safety
 Worker Safety